
Policies to Address U.S. Racial-Ethnic Inequality in Exposure to PM2.5
The Clean Air Act has dramatically reduced outdoor air pollution levels in the US over the past decades, yet national racial-ethnic exposure disparities persist. People of color, and low-income populations are exposed to higher PM2.5 concentrations. It is unknown whether the current government policies for improving air quality and adressing environmental injustice will adress or eliminate those exposure disparities.
I have published two research papers on this topic. Wang et al. PNAS. 2022 investigates three general emission-reduction approaches, and compare their optimal ability to address the disparity. Wang et al. Science. 2023 quantifies the effects of Climate and Economic Justice Screening Tool (CEJST), which is a signature component of Biden Administration’s Justice40 Initiative, and is the current method to define disadvantaged communities. In both research projects, we employ InMAP (Intervention Model for Air Pollution) source-receptor matrix (ISRM) to predict how changes in emissions impact annual-average PM2.5 concentrations and exposure inequalities.
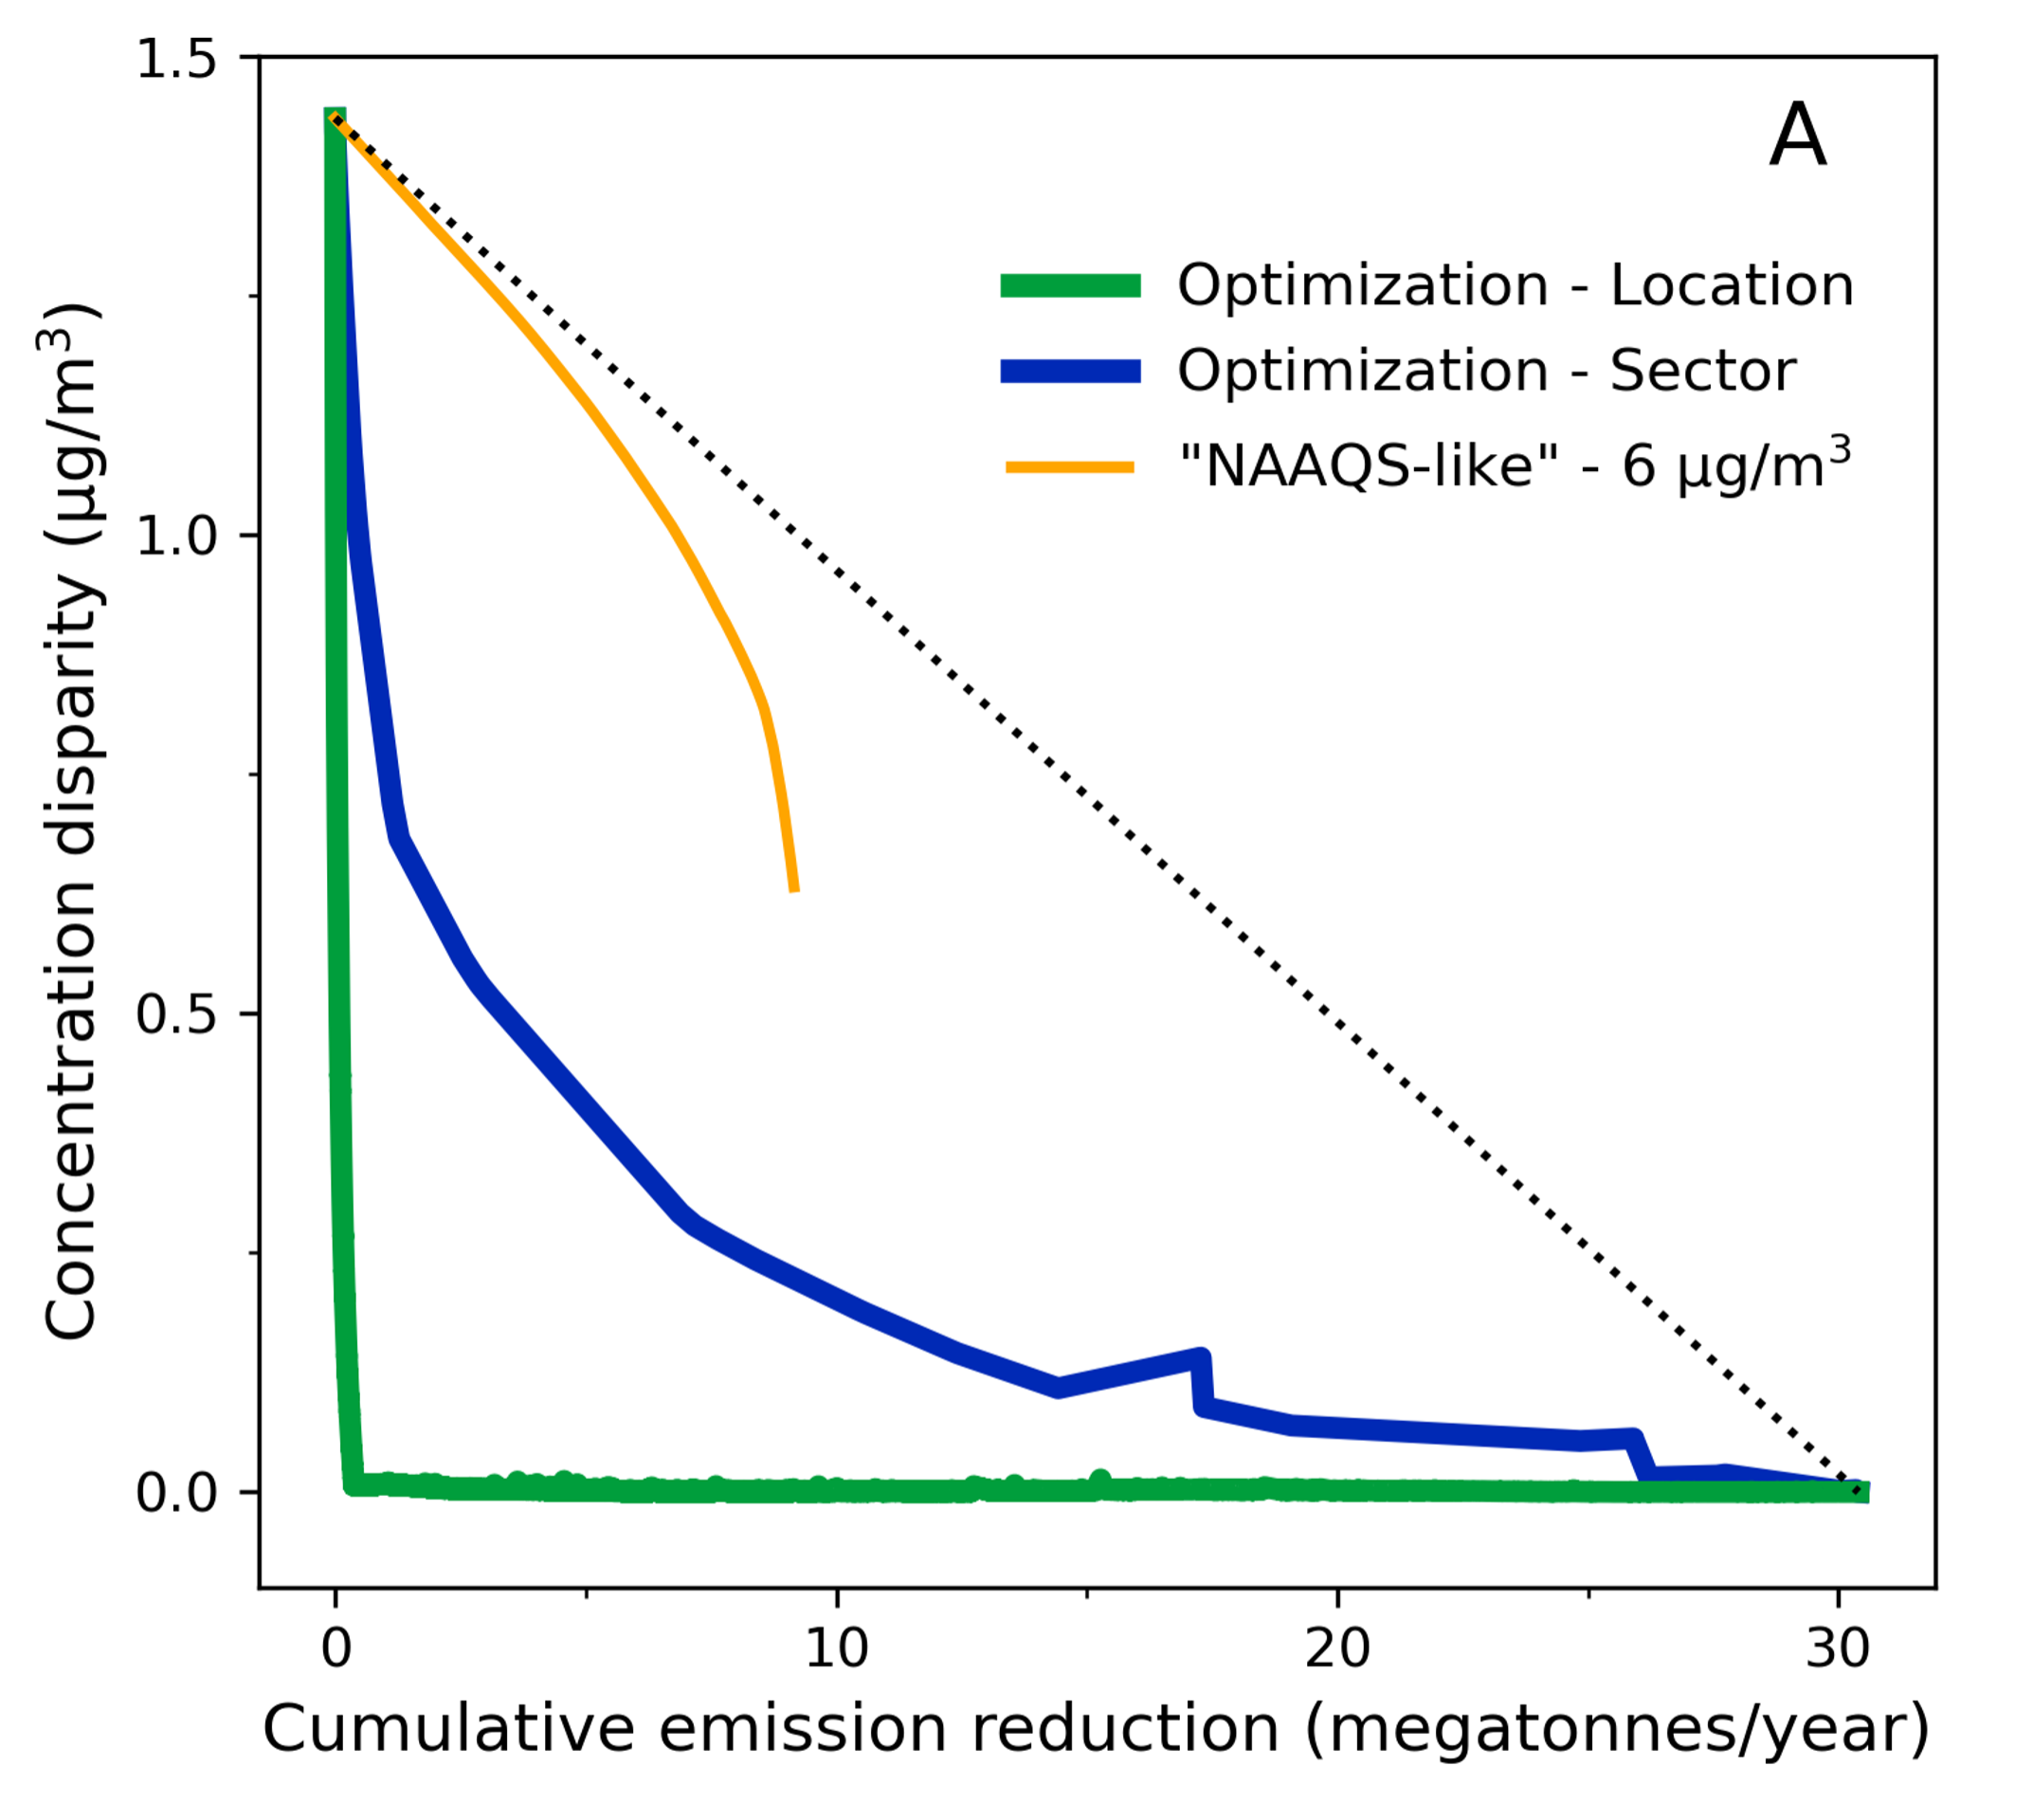
We compare three broad approaches of emission reductions: 1) “location”-specific approach; 2) “sector”-specific approach; and 3) “NAAQS-like” approach. “Sector” and “NAAQS-like” mirror aspects of current air quality regulations, “location” would be a new regulatory approach. Our results suggest that two main current regulatory strategies are ineffective at addressing national average racial-ethnic inequalities. In contrast, those inequalities can be eliminated with modest emission-reduction (optimal: ~1% of total emissions) using a location-specific approach. That approach is not included in current national regulatory frameworks (but it is being discussed, and some states have implemented it); also, that approach does as well as or better than the two other approaches, at the goal of reducing overall population average. This research informs the active national conversation about addressing environmental injustice, by providing a scientifically grounded approach for eliminating disparities.

We find that air pollution exposure disparities will persist if the past trends of emission-reductions are to continue into the future. We also reveal that Biden administration’s current method for identifying disadvantaged communities (CEJST), if used to identify where to prioritize emissions reductions, will only eliminate disparities by income, but will not meaningfully reduce racial-ethnic air pollution disparities, even if the emissions reductions are aggressive or very aggressive. This is because CEJST is blind to racial/ethnic composition, and is also because the policy effects on disparities are not quantified prior to implementation. The largest exposure disparities are by race-ethnicity; disparities by race are larger than, and statistically distinct from, those by income. So policies cannot ignore race if they wish to eliminate air pollution disparities. New tools now make it possible to investigate whether proposed actions will eliminate the exposure disparities we see.
Publication: Wang et al. PNAS. 2022, Wang et al. Science. 2023
Environmental Inequality in China
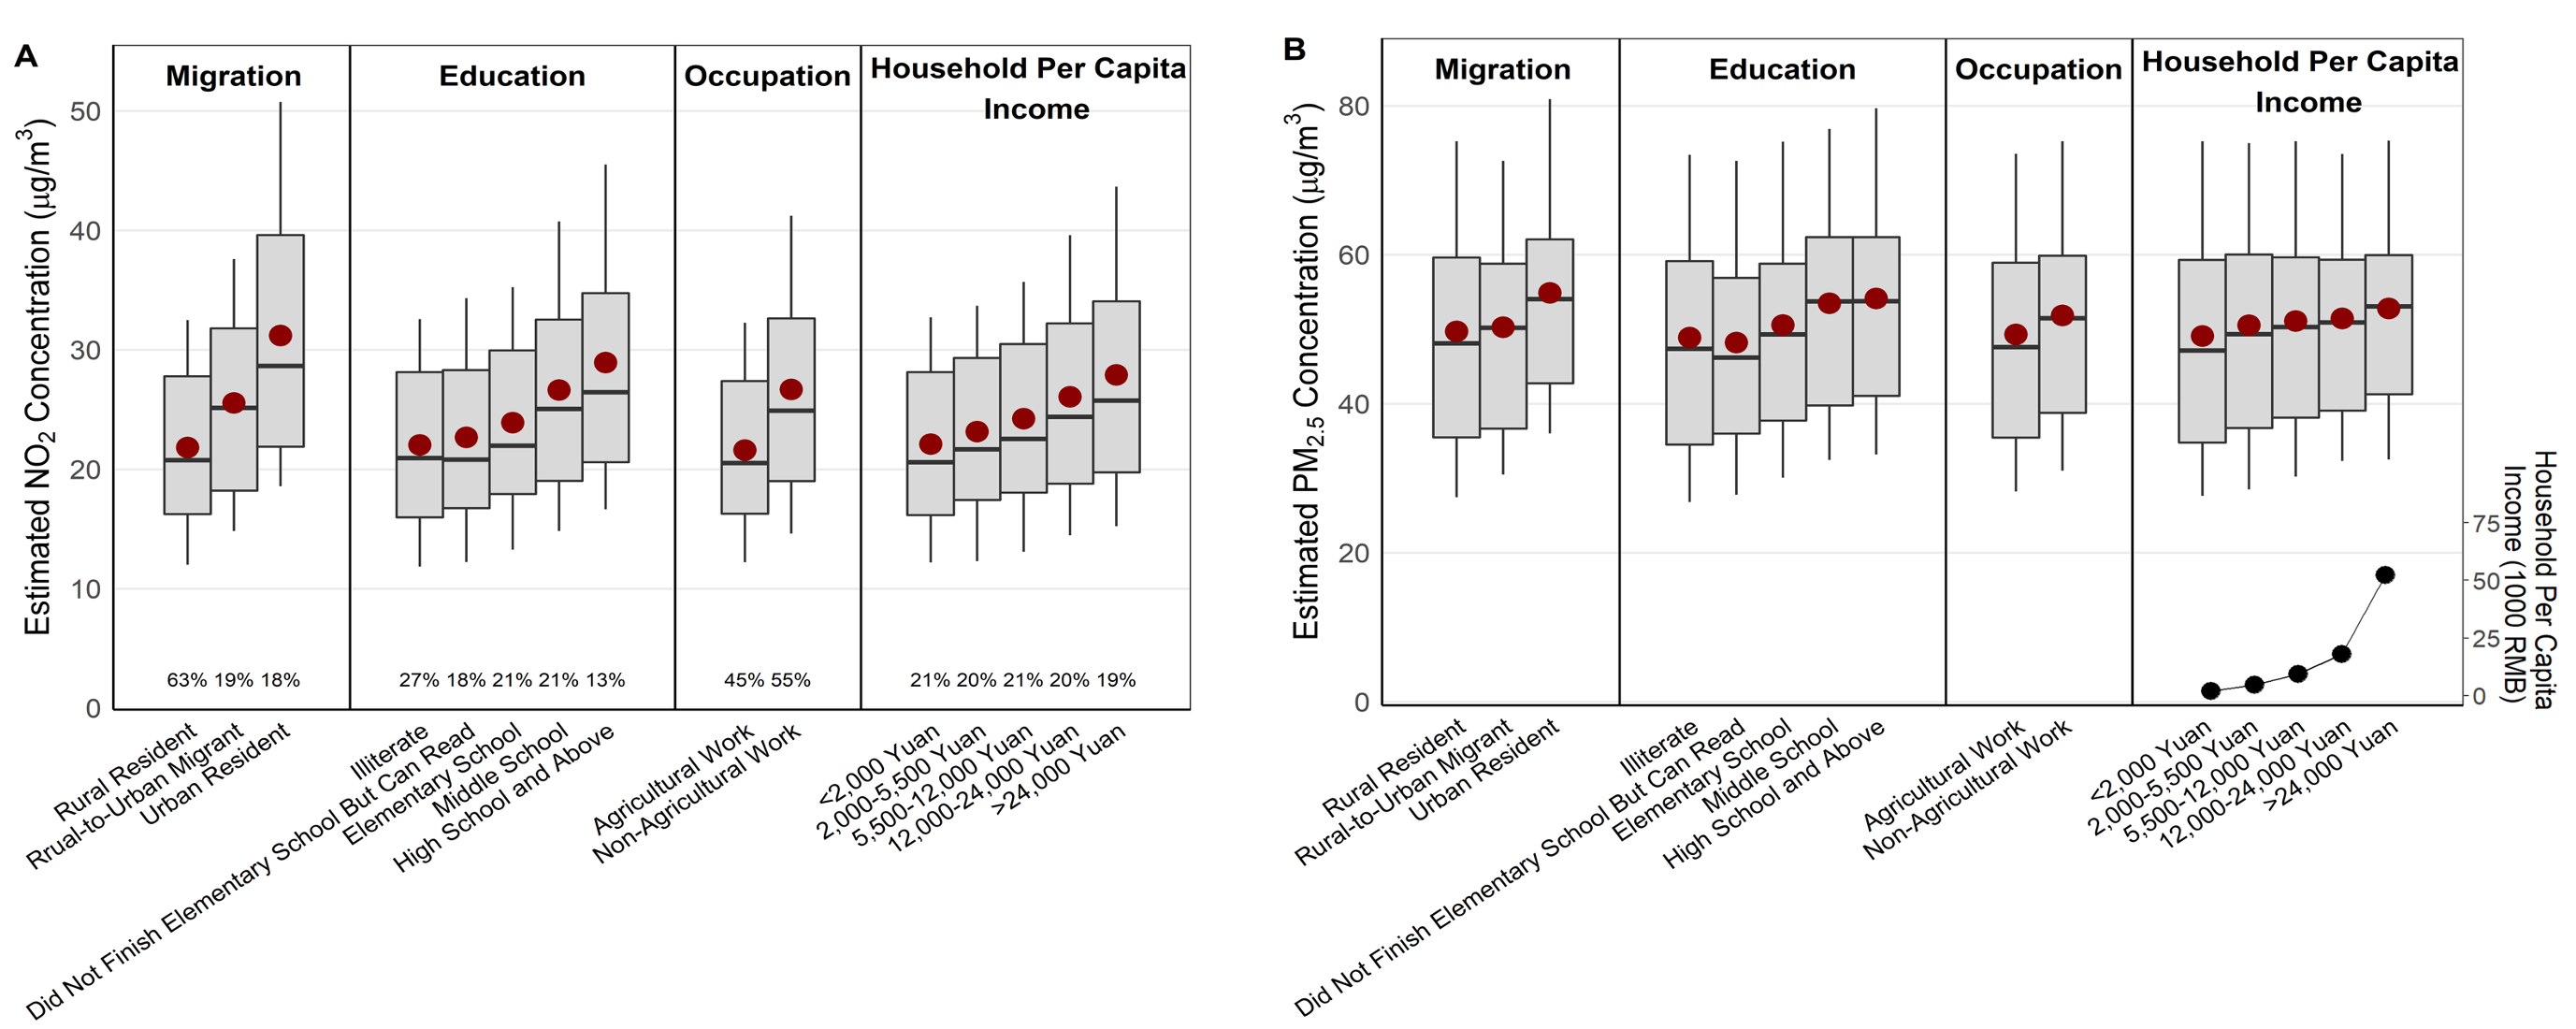
Air pollution disparities by socioeconomic status (SES) display an inverse relationship (i.e., higher concentrations for lower-SES populations) in US and many high-income countries. However, my study indicate a reverse pattern in China (a country accounting for 26% of global premature deaths from ambient air pollution). Combing air pollution data from a national empirical model and demographic data from (1) national gridded GDP per capita, and (2) a national representative sample of 21,095 individuals from the China Health and Retirement Longitudinal Study (CHARLS), we quantify air pollution disparities among individual’s rural-to-urban migration status; SES factors (education, occupation, and income); and minority status. Results indicate that in China, ambient NO2 and PM2.5 concentrations are higher for high-SES than for low-SES individuals; these results are robust to multiple sensitivity analyses. The findings imply that in China’s current industrialization and urbanization stage, economic development is correlated with both SES and air pollution.
Publication: Wang et al. EHP. 2022
Spatial Decomposition of Air Pollution
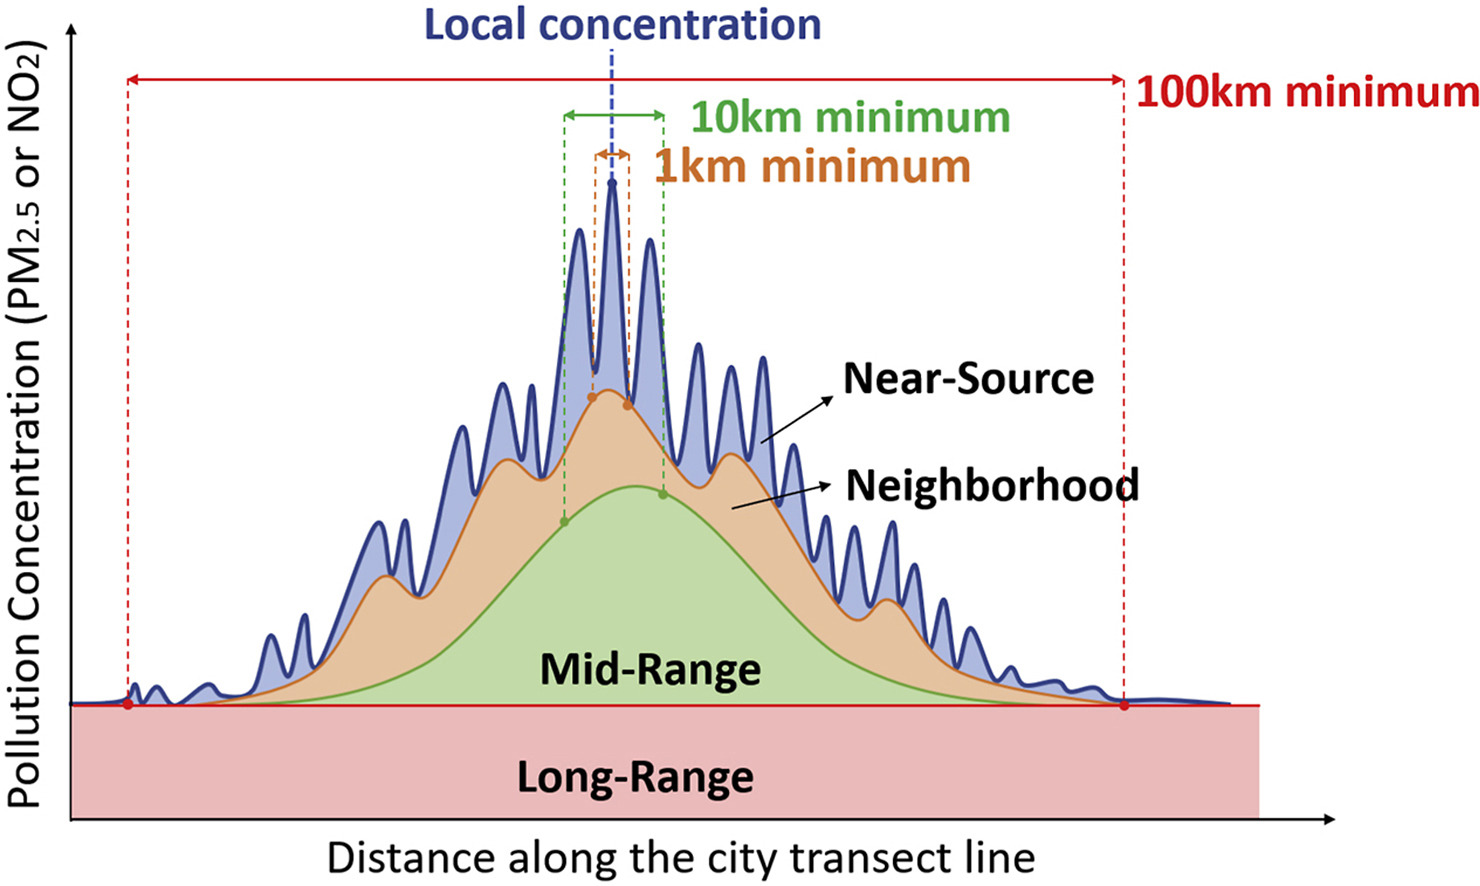
The spatial variability of air pollution concentrations varies depending on pollutant type and geographic location. We develop a readily scalable algorithm based on “spatial-increment”, to decompose the air pollution concentration into four spatial components: long-range, mid-range, neighborhood, and near-source. We apply the algorithm to annual-average concentrations of outdoor NO2 and PM2.5 for all census blocks in the contiguous US. We show that for NO2, “neighborhood” and “mid-range” components dominate both within-city and between-city concentration differences, yet for PM2.5, the “long-range” component at regional level dominates. Our results can be used to estimate the contribution of sources at different distances from the receptor to the annual average pollution in a location of interest. The datasets have already been applied in environmental health and environmental justice analyses.
Publication: Wang et al. AE. 2020; Lefler et al. EH. 2019
Dataset: Wang. Mendeley Data. 2020; Wang. Mendeley Data. 2021